
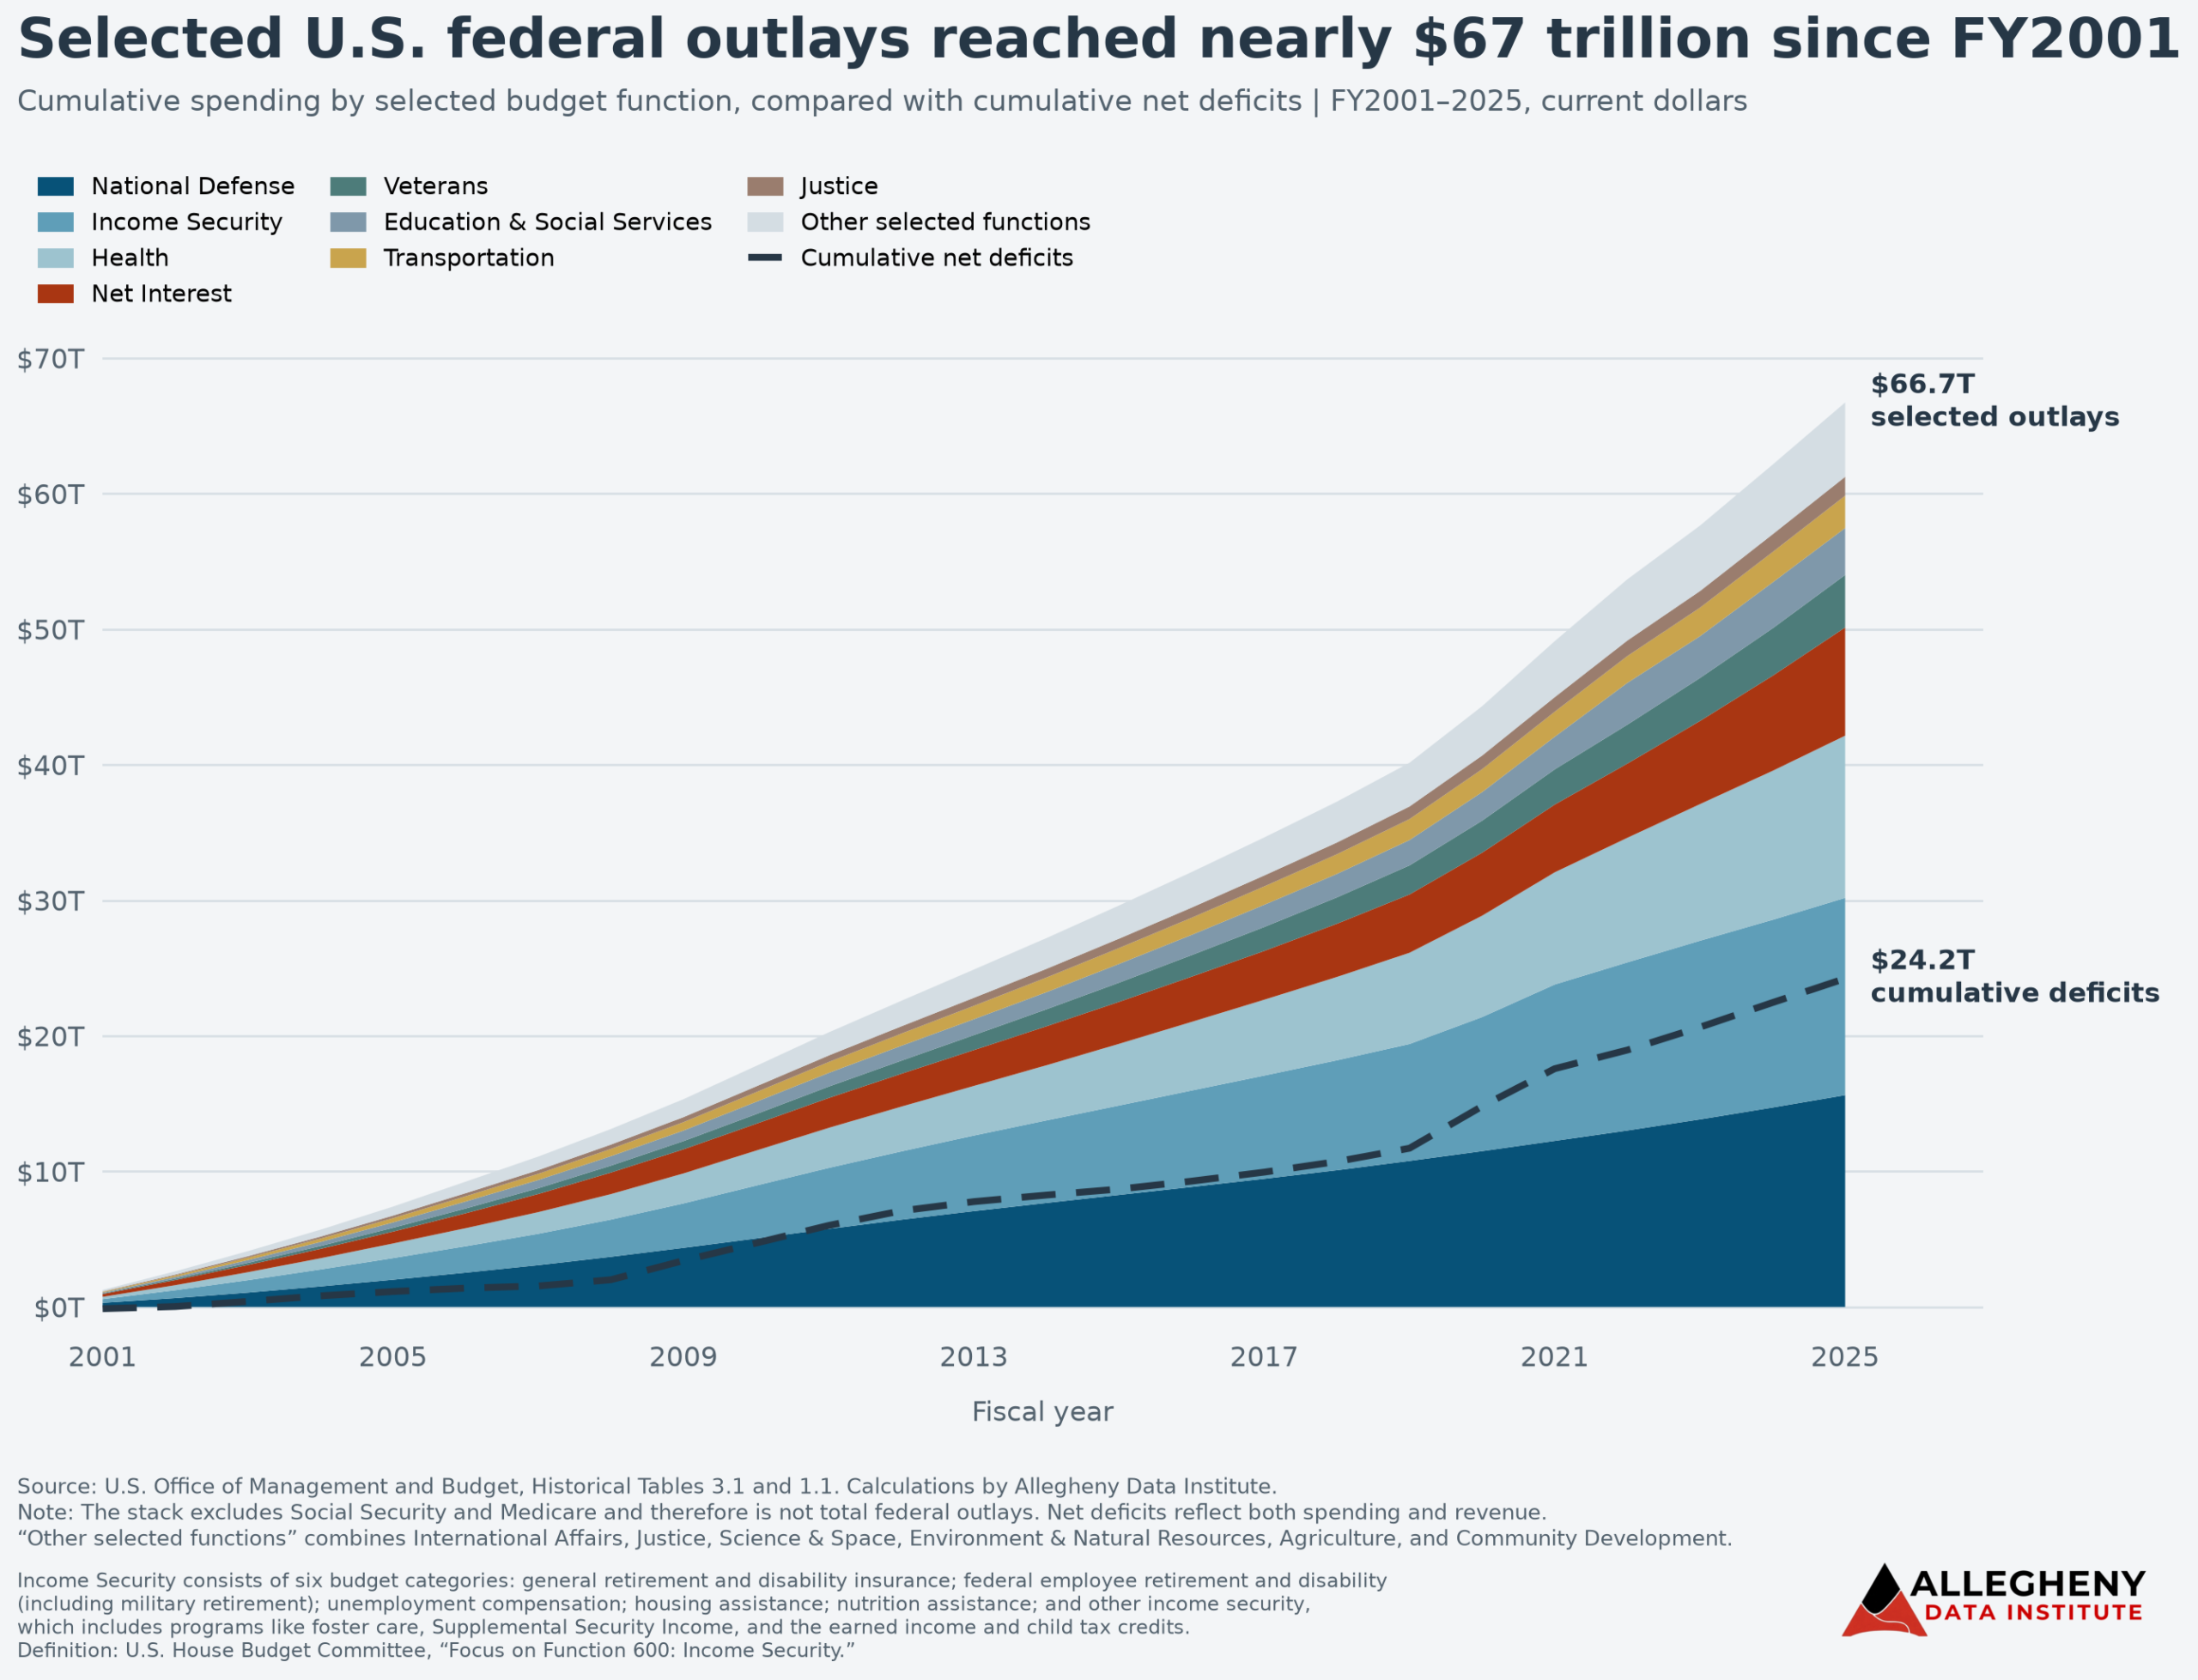
Key Finding: Today, it was announced that the national debt had exceeded $40 trillion dollars. From 2001 through 2025, the federal government accumulated about $24.2 trillion in net deficits. Over the same period, cumulative spending on National Defense reached about $15.6 trillion, Income Security about $14.5 trillion, Health about $12.0 trillion, and Net Interest about $8.0 trillion. Social Security and Medicare are excluded from this comparison because those programs are financed through dedicated payroll taxes, premiums, and trust-fund mechanisms.
What the Data Shows: National Defense was the largest cumulative spending category over the 25-year period, followed closely by Income Security and Health. Spending on Net Interest also became a major component of federal expenditures, totaling nearly $8 trillion between 2001 and 2025.
The cumulative deficit line shows how annual federal deficits compounded over time. The most significant acceleration occurred beginning in 2020, when emergency pandemic spending and reduced federal revenues sharply increased annual deficits. Although deficits declined from those extraordinary levels, cumulative deficits continued to rise and reached approximately $24.2 trillion by the end of fiscal year 2025.
Analysis: The comparison demonstrates that no single federal function accounts for the accumulated deficit. However, National Defense stands out as the largest individual category among the selected functions, while Net Interest represents an increasingly important fiscal burden. Unlike program spending on health, education, transportation, or veterans, interest payments do not provide a public service.
The visualization does not identify which programs should be reduced or whether federal revenues should be increased. Rather, it places major federal spending commitments alongside the accumulated federal deficit so that readers can assess the relative scale of those expenditures and the fiscal choices involved.
Method: We used U.S. Office of Management and Budget historical federal outlay data for fiscal years 2001 through 2025 and calculated cumulative spending for major federal budget functions.
Net Interest was included as a separate category because it represents the federal government’s cost of servicing accumulated borrowing.
The dashed line represents the cumulative sum of annual federal deficits beginning in fiscal year 2001. It should not be interpreted as assigning the deficit proportionally or causally to any individual spending category.
Sources: U.S. Office of Management and Budget, Historical Tables, including Table 3.1, Outlays by Superfunction and Function, and related historical budget tables for federal receipts, outlays, and deficits.
Download the Data:
Leave a Reply