
Key Finding: This brief draws on an ADI report prepared for a housing advocacy group working in the East Liberty neighborhood of Pittsburgh. It examines redevelopment and demographic change to inform housing advocacy. The central finding is that extensive investment accompanied a substantial decline in Black residents, while Penn Plaza provides direct evidence of redevelopment-related displacement.
The Redevelopment Strategy East Liberty followed a public–private reinvestment strategy: major retail destinations, transit-oriented development, property reuse and mixed-income housing renewal. Mosites was a principal private developer through Eastside; East Liberty Development Inc., the Urban Redevelopment Authority, the City of Pittsburgh and the transit authority supported partnerships, financing and infrastructure. Walnut Capital developed housing within East Liberty and the nearby Bakery Square campus. LG Realty Advisors and related Gumberg interests controlled Penn Plaza and developed Liberty East. The Housing Authority and McCormack Baron Salazar participated in the Larimer–East Liberty Choice Neighborhoods initiative. [1–5]
Who Lives in East Liberty Changed Dramatically
Selected indicators from the published UCSUR neighborhood profiles. [6–8]
| Indicator | 2000 Census | 2020–2024 ACS |
| Total population | 6,871 | 6,645 |
| Black residents | 4,980 (72.5%) | 2,711 (40.8%) |
| White residents | 1,478 (21.5%) | 2,760 (41.5%) |
| Bachelor’s degree or higher | 18.5% | 52.3% |
| Below poverty threshold | 29.7% | 14.5% |
The comparison shows 2,269 fewer Black residents, a decline of approximately 45.6 percent, while total population remained fundamentally unchanged. The Black share fell by 31.7 percentage points. Higher educational attainment and a lower measured poverty rate are consistent with gentrification, and a lower poverty rate does not establish that original low-income residents became better off. It also reflects a change in who can remain or move into the neighborhood. [6–8]
Displacement and the Next Phase
Penn Plaza documents the human consequences of this type of redevelopment. More than 200 residents were displaced after notices issued in 2015 by LG Realty Advisors; all tenants had relocated by March 2017. The City acknowledges that mass displacement in its current review of the site. This evidence supports displacement language for Penn Plaza. The wider loss of Black residents raises concerns about displacement and exclusion. [6, 7, 9, 10]
The City’s Penn Plaza Block B review and Walnut Capital’s December 2025 revised Bakery Square Connector proposal indicate continued development interest beyond the historical study period. Further investment and housing turnover could bring additional demographic changes; their scale and direction remain uncertain. Advocacy should track whether Black and lower-income households can remain, including actual affordable housing delivery, housing costs, resident retention and displacement. [10, 11]
Using the Evidence in Advocacy
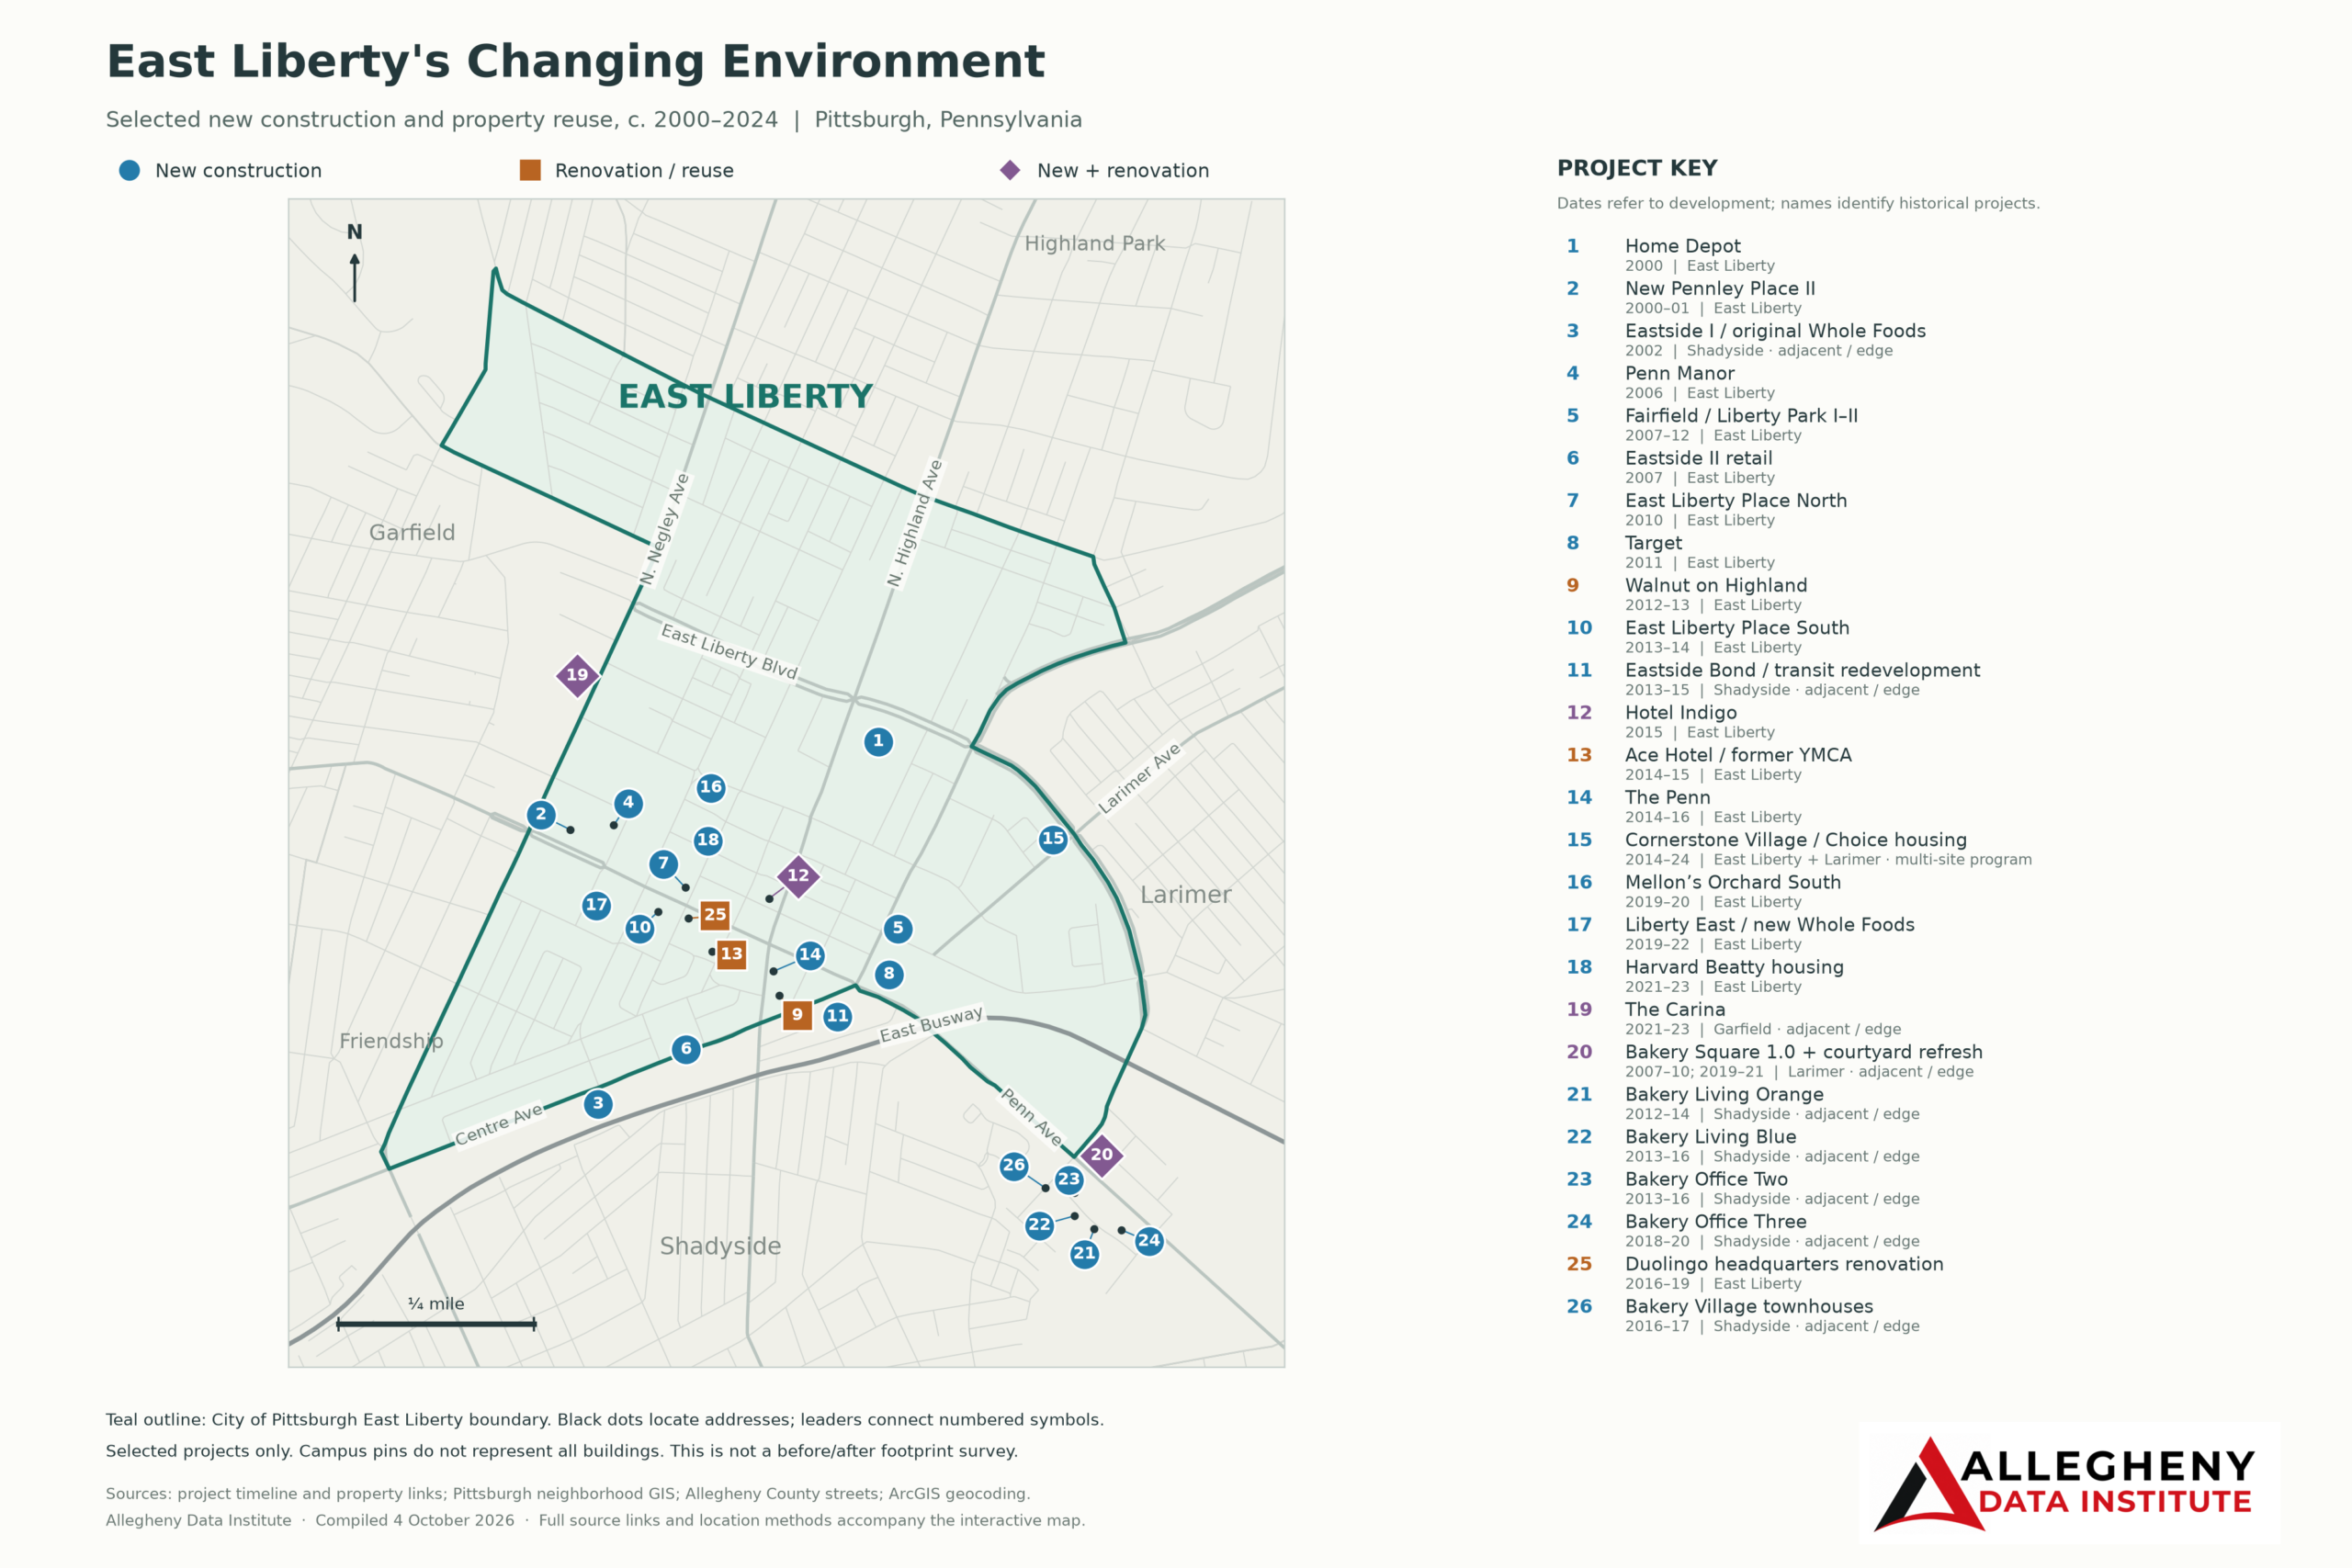
The accompanying map above identifies 26 selected new construction and renovation locations from roughly 2000–2024. It distinguishes East Liberty from adjacent catalysts, including Bakery Square in Larimer and Shadyside. The demographic notebook recreates the full 17-indicator table. Together, these tools connect physical redevelopment to neighborhood change while preserving source links and methods. The map uses representative locations, not historical building footprints, and adjacent projects are not added to East Liberty’s demographic totals.
An Invitation to Advocacy Groups
Allegheny Data Institute invites other advocacy groups to discuss a neighborhood or municipality report focused on the issue they are working on. Whether the concern is housing affordability, displacement or access to local resources, we can help frame the question, identify appropriate evidence and present the findings in a clear report with useful maps, figures, and tables. Our aim is to support advocacy with evidence that is understandable, transparent about its limits and attentive to the people affected.
Methods: ACS figures pool 2020–2024 responses; they are estimates, not a single-year 2024 census count. This comparison joins published neighborhood profiles across Census vintages without boundary harmonization. Modern East Liberty uses tracts 1113 and 1115. Sampling uncertainty applies and differences have not been significance-tested. Race reporting and coding evolved over the period.
Source Notes:
1 Mosites Eastside · 2 URA transit development · 3 Walnut developments · 4 Liberty East · 5 HACP Choice housing
6 UCSUR 2000 demographics · 7 UCSUR 2020–2024 ACS · 8 UCSUR 2000 social and economic profile
9 PublicSource Penn Plaza chronology · 10 City Penn Plaza Block B · 11 Walnut Connector proposal
Leave a Reply