
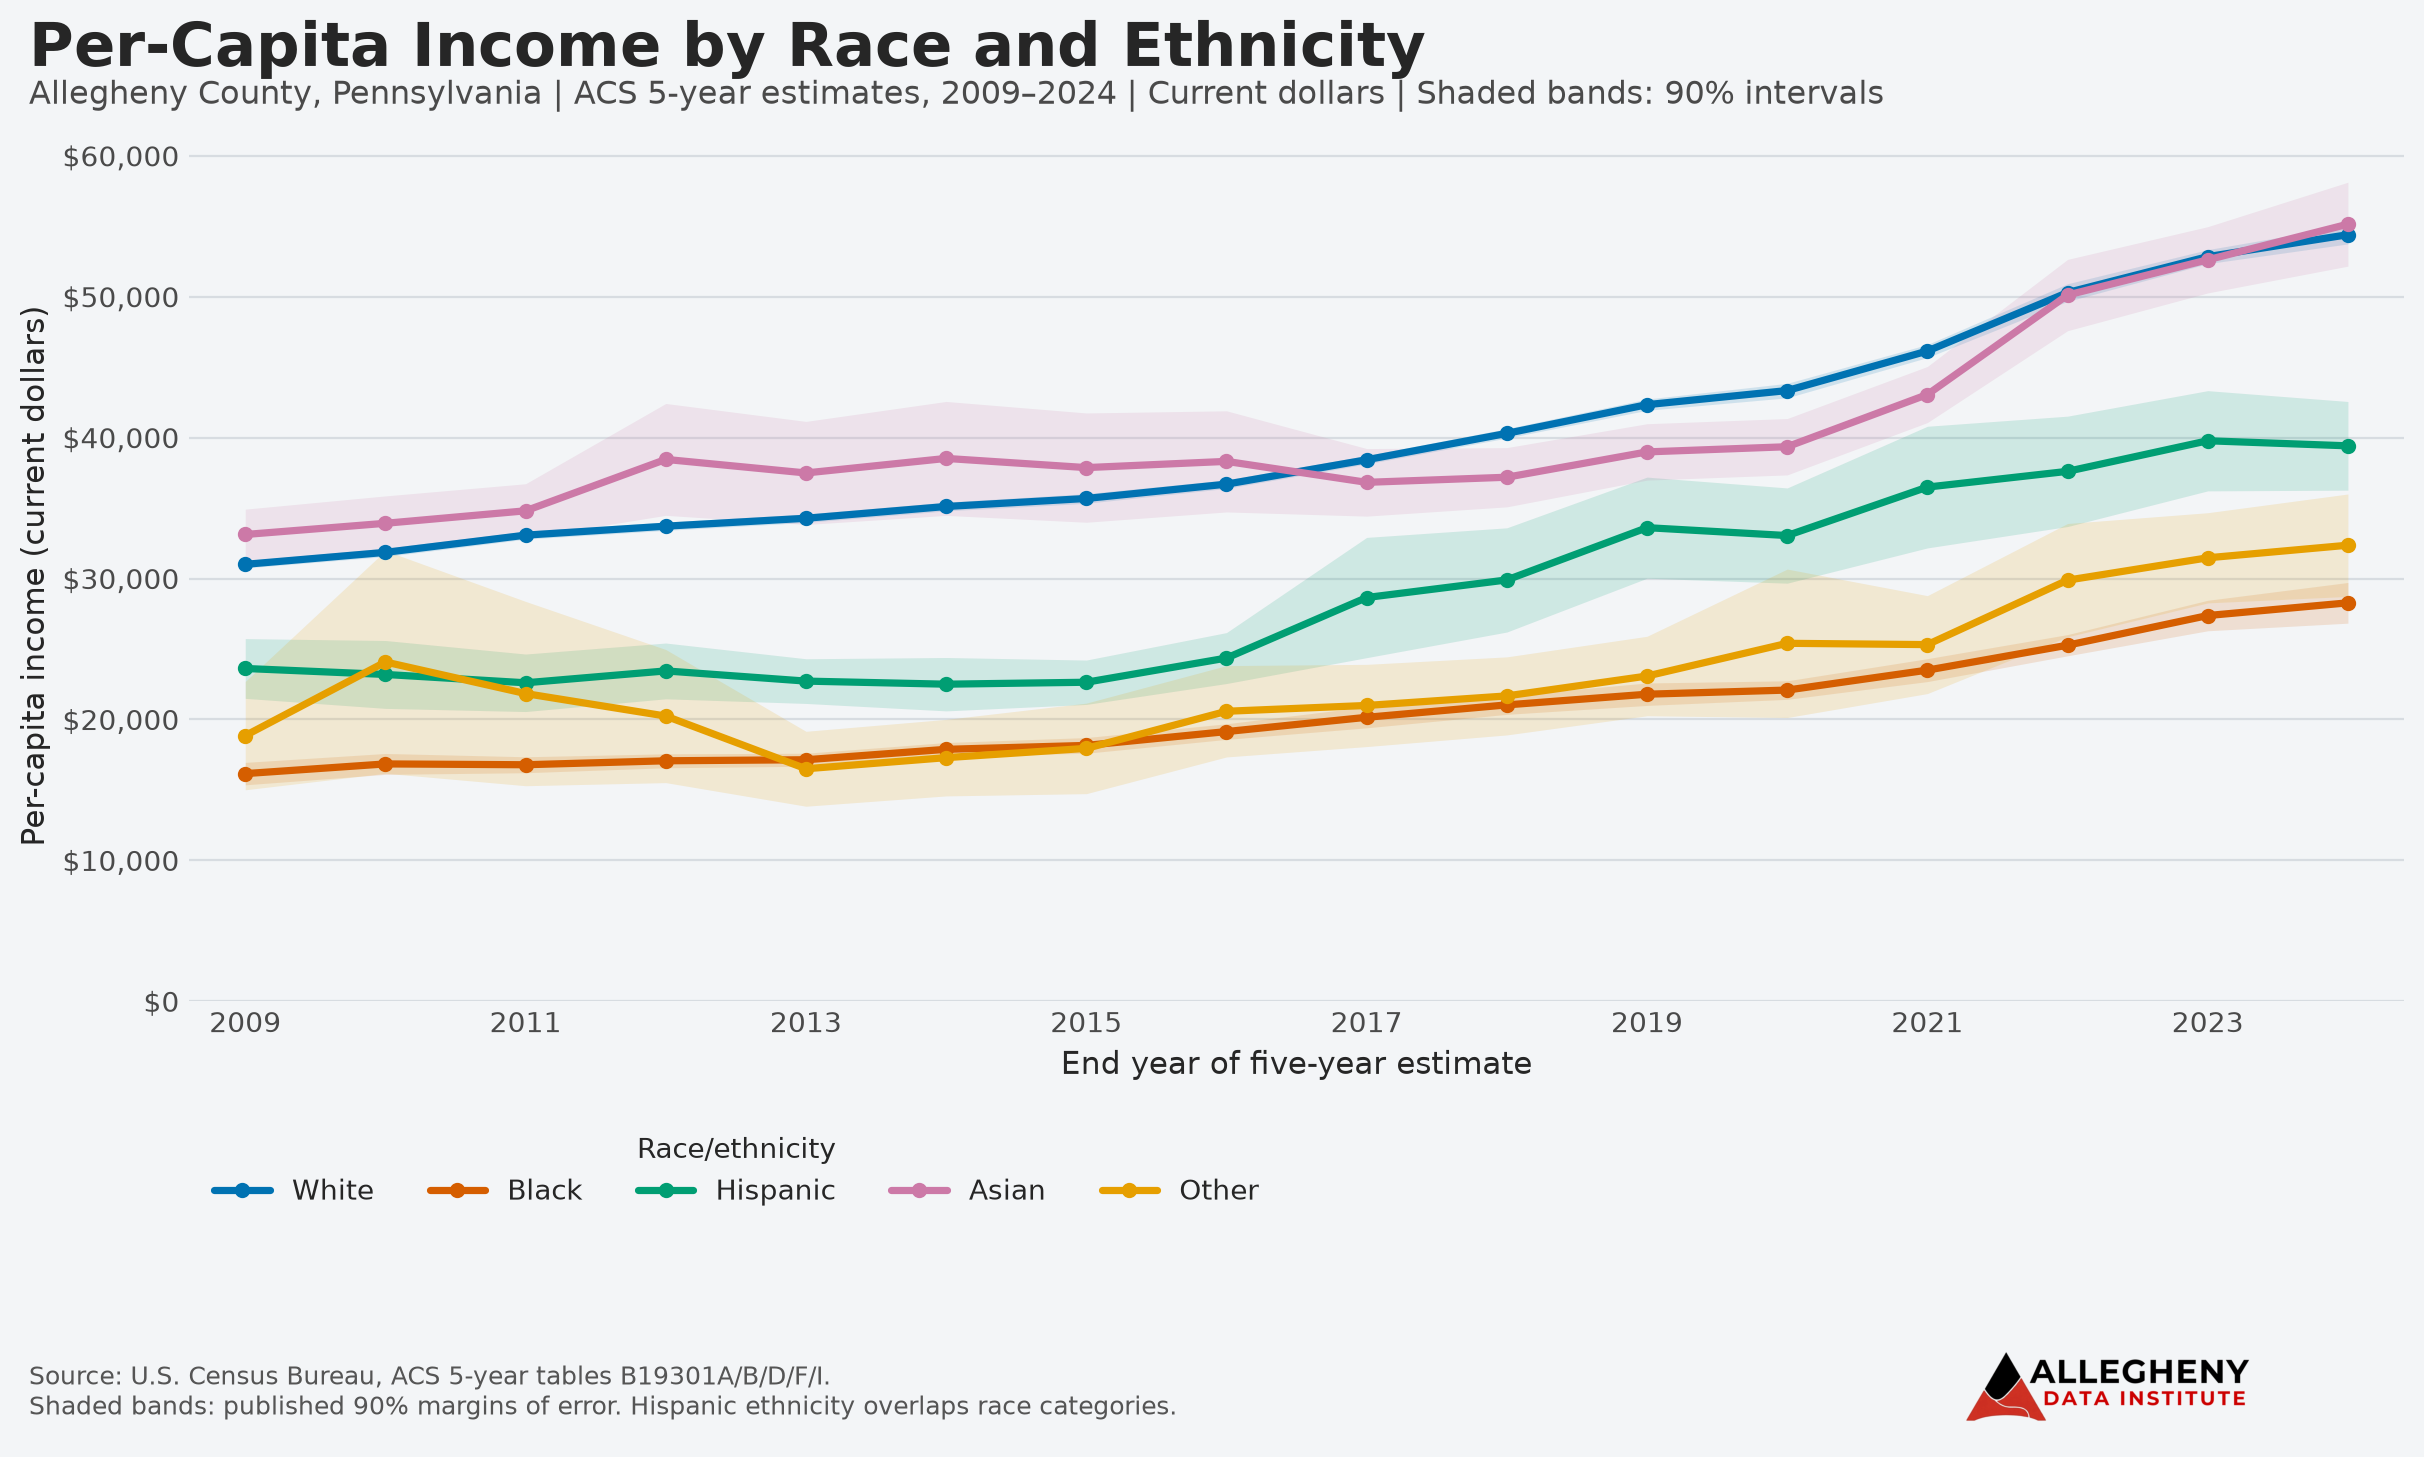
Key Finding: Per-person income increased for every racial and ethnic group shown in Allegheny County between 2009 and 2024. However, the income gaps between groups remained large. The percentage difference between White and Black residents was almost unchanged over the period. It was 63.0% in 2009 and 63.2% in 2024.
The percentage difference between White and Hispanic residents grew from 27.1% in 2009 to 31.9% in 2024.
What the Data Shows: In 2024, estimated per-capita income in Allegheny County was:
- $54,403 for White residents
- $28,278 for Black residents
- $39,419 for Hispanic residents
- $55,150 for Asian residents
- $32,367 for residents classified as Other race
The dollar gap between White and Black residents increased from $14,852 in 2009 to $26,125 in 2024. The dollar gap between White and Hispanic residents increased from $7,391 to $14,984 during the same period. To compare these differences more fairly over time, we also look at the gap as a percentage of the average income of the two groups being compared.
Using that measure, the White–Black income gap was almost the same in 2024 as it was in 2009. The White–Hispanic gap was somewhat larger.
Analysis: The main story in these data is not that incomes failed to grow. They did grow for every group shown. The larger issue is that the distance between groups did not shrink very much. Black residents remained far below White residents in per-capita income throughout the period, and the relative gap was almost exactly the same in 2024 as it was in 2009. The White–Hispanic income gap also did not narrow. In fact, it became somewhat larger.
These data describe what happened, but they do not tell us why the differences exist. Other research would be needed to examine factors such as employment, wages, education, housing, wealth, discrimination, or other social and economic conditions.
Method: This brief uses data from the U.S. Census Bureau’s American Community Survey, or ACS.
Per-capita income means the total income of a group divided by the number of people in that group. It is one way to compare overall economic conditions across populations. The data come from several ACS tables that report per-capita income by race and ethnicity. The series begins with the 2005–2009 ACS estimate, which we label as 2009, and ends with the 2020–2024 estimate, which we label as 2024. Together, these estimates cover roughly two decades.
The shaded areas in the chart show the Census Bureau’s published margin of error. These bands remind us that survey estimates include some uncertainty and should not be treated as exact counts.
Source: U.S. Census Bureau, American Community Survey 5-year estimates, 2009–2024; Tables B19301A, B19301B, B19301D, B19301F, and B19301I.
Download the Data: U.S. Census Bureau, American Community Survey: https://data.census.gov/
Leave a Reply