
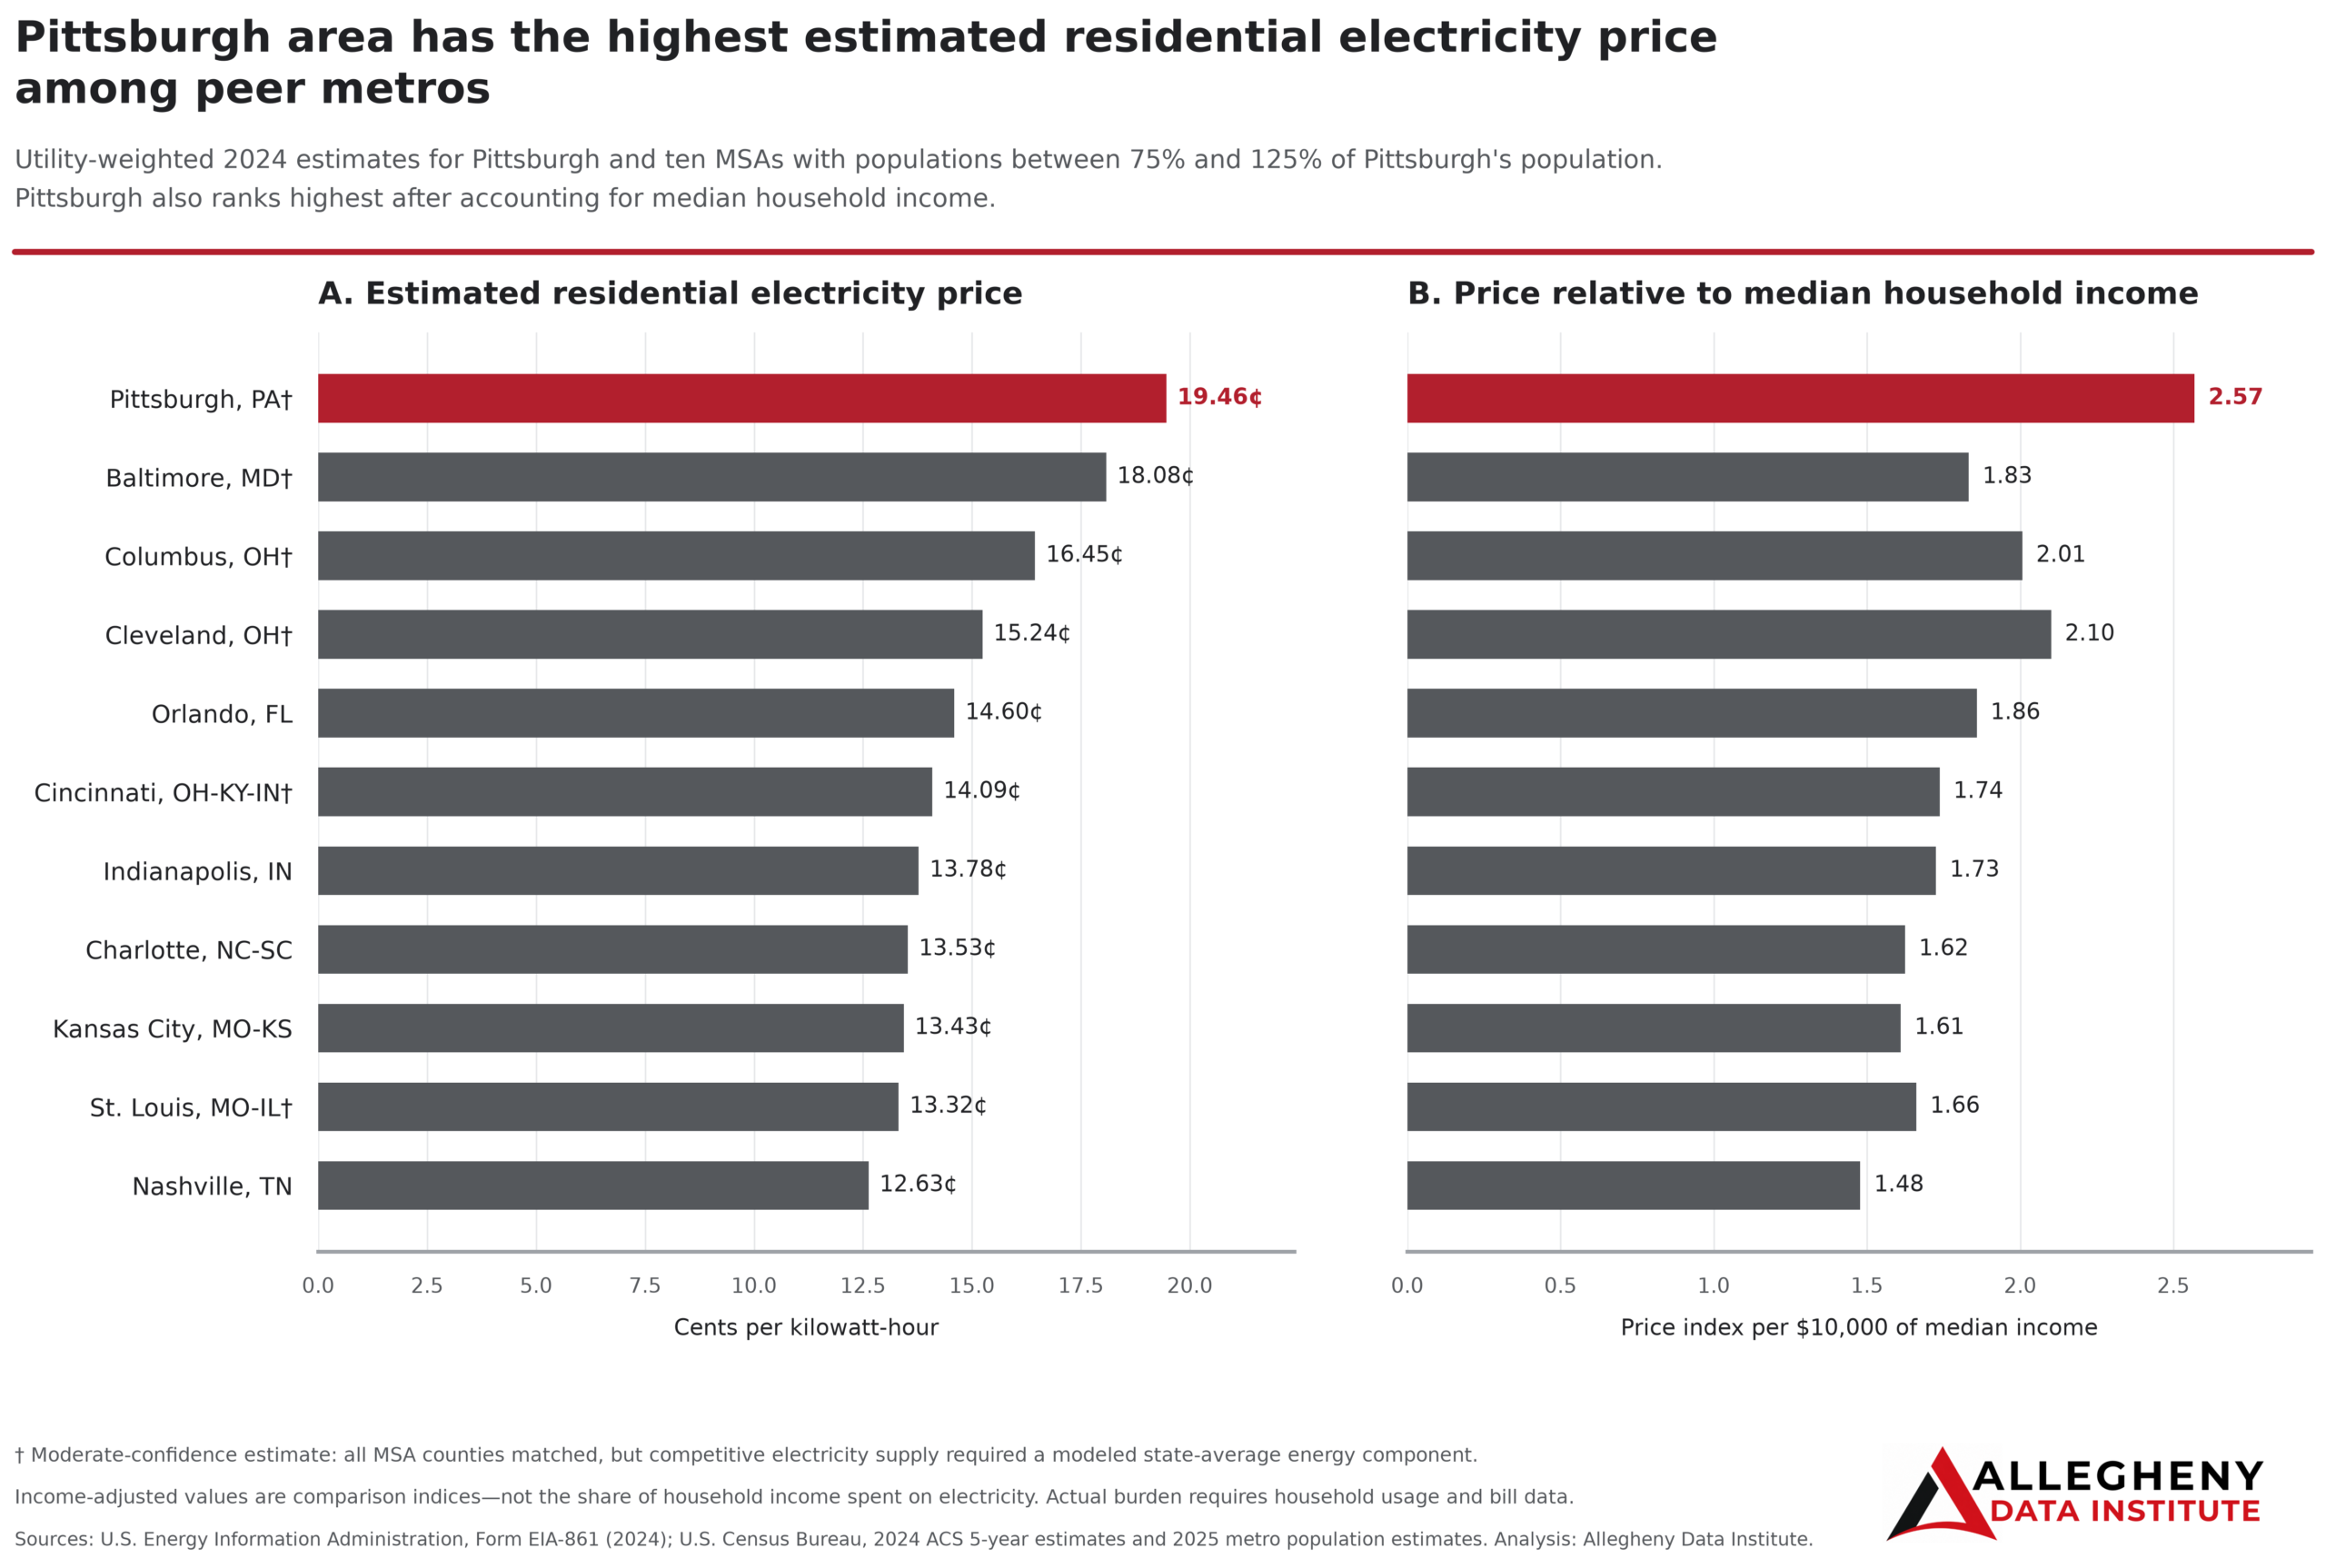
Key Finding: Pittsburgh had the highest estimated residential electricity price among the 11 metropolitan areas examined.
In 2024, Pittsburgh’s estimated residential price was 19.46 cents per kilowatt-hour. That was about 34% higher than the 14.51-cent average among the other ten metropolitan areas.
Baltimore ranked second at 18.08 cents per kilowatt-hour. Pittsburgh’s estimated price was about 8% higher than Baltimore’s and 54% higher than Nashville’s, the lowest-priced metropolitan area in the comparison.
What the Data Shows: The comparison includes the ten metropolitan statistical areas nearest to Pittsburgh with populations between 75% and 125% of Pittsburgh’s population. Estimated residential electricity prices ranged from:
- 19.46 cents per kilowatt-hour in Pittsburgh
- 18.08 cents in Baltimore
- 16.45 cents in Columbus
- 15.24 cents in Cleveland
- 12.63 cents in Nashville
These figures measure the price of electricity, not the total amount a household pays. Monthly bills also depend on electricity use, housing characteristics, weather, and other factors.
Analysis: Household income provides additional context for the price comparison. Pittsburgh’s 2024 median household income was approximately $75,800. That was lower than the median household income in eight of the ten comparison metropolitan areas. Baltimore, the only area with an estimated electricity price close to Pittsburgh’s, had a median household income of approximately $98,700.
To compare prices with local income, ADI calculated an income-adjusted index. The index divides the estimated electricity price by median household income measured in $10,000 increments. Pittsburgh had the highest index in the group at 2.57. Cleveland ranked second at 2.10, followed by Columbus at 2.01.
Pittsburgh’s index was approximately 46% higher than the average for the other ten metropolitan areas. Its position therefore does not appear to be explained by having a correspondingly high household income.
Method: The U.S. Energy Information Administration publishes residential electricity sales, revenue, customer, and service-territory information by utility and state. It does not publish a standard residential electricity price for every metropolitan area.
ADI estimated metropolitan-area prices by combining two components of the 2024 EIA-861 dataset:
- Sales to Ultimate Customers, which reports residential electricity revenue, sales, and customer totals by utility and state.
- Service Territory, which identifies the counties served by each utility.
Utilities were assigned to metropolitan counties using official metropolitan-area definitions. Each utility’s statewide residential totals were then allocated among the counties in its reported service territory according to the counties’ shares of households.
For states with competitive electricity supply, the estimate combines the delivery portion reported by utilities with the state’s average competitive energy-supply component. This adjustment avoids counting the same electricity sales twice.
The resulting figures are utility-weighted metropolitan estimates. They provide a closer approximation of local electricity prices than statewide averages, but they are not published utility tariffs or direct averages of individual household bills.
Sources:
U.S. Energy Information Administration, Form EIA-861, Annual Electric Power Industry Report, 2024.
U.S. Census Bureau, American Community Survey, 2024.
U.S. Office of Management and Budget and U.S. Census Bureau, metropolitan statistical area delineations, 2023.