
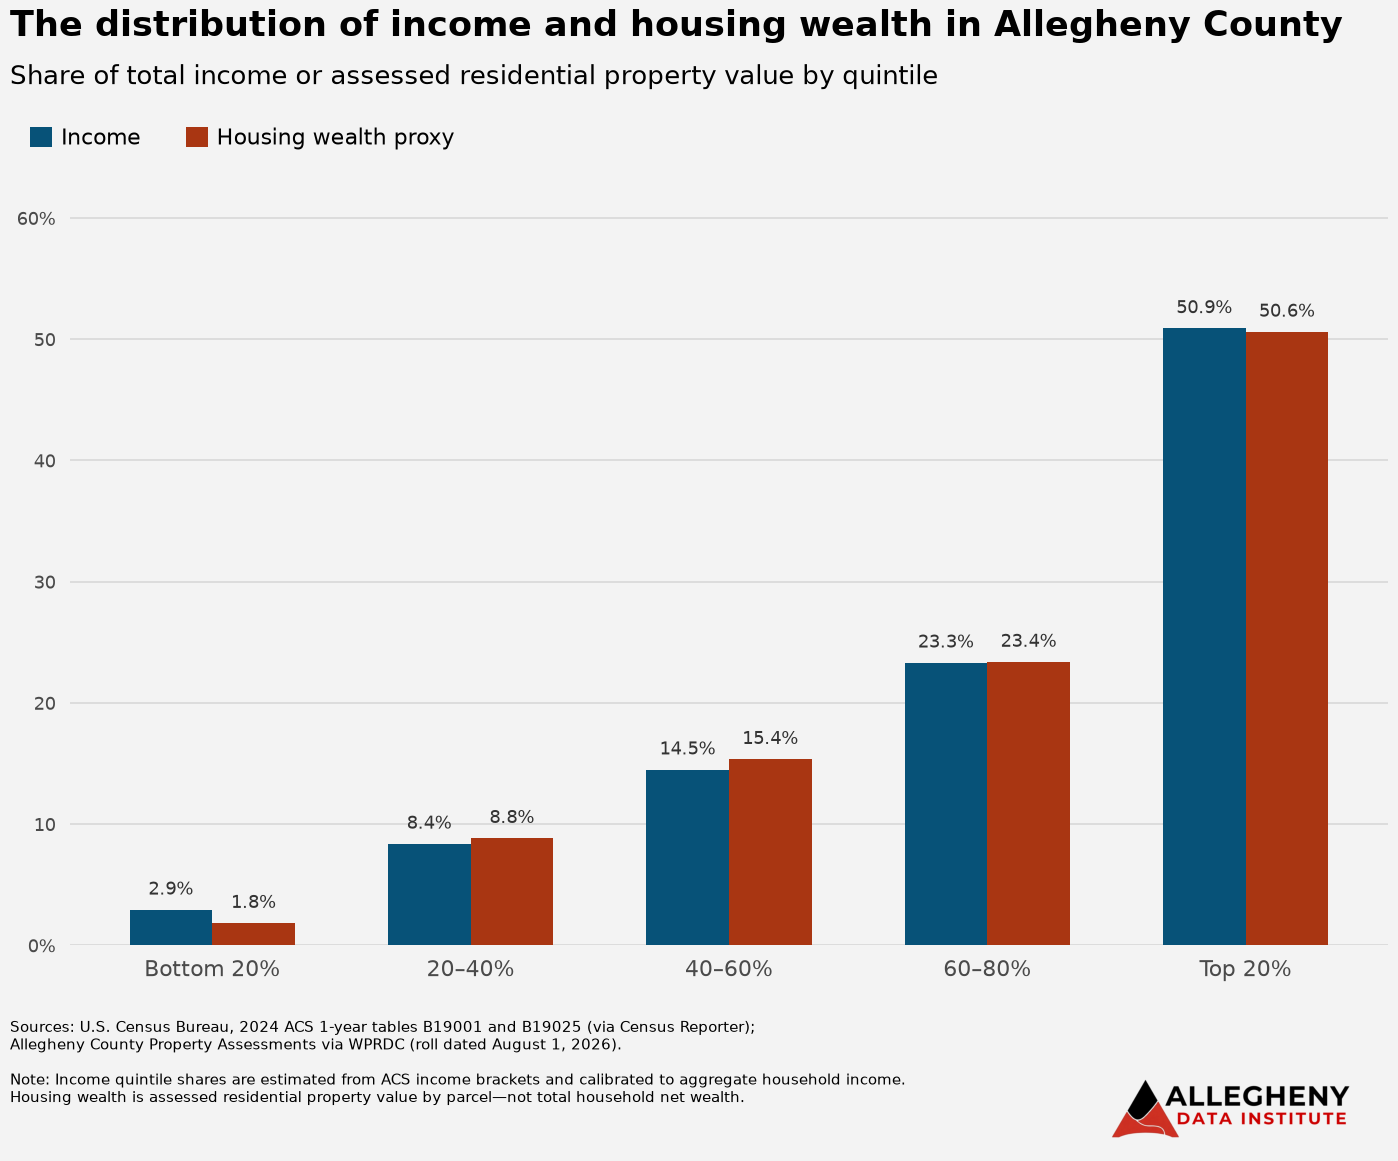
Key Finding: In Allegheny County, income and home values are concentrated at the top. The top 20% bring in half of all income, and the top 20% of residential properties make up half of all housing value.
Note: This data measures home property values, not total personal wealth (like stocks or savings accounts). Total wealth data is not available at the county level.
What the Data Shows: The top 20% of households make 50.9% of the county’s total income. The lowest 40% of households bring in just 11.3% combined (2.9% for the lowest group and 8.4% for the second).
The top 20% most valuable properties make up 50.6% of all residential property value in the county. The lowest 40% of properties make up only 10.6% combined (1.8% for the lowest group and 8.8% for the second).
Analysis: Both income and property values show a steep divide. In Allegheny County, the top fifth takes home over half the income and holds over half the property value. Meanwhile, the bottom two-fifths share about one-tenth of the total income and housing value.
Method: We grouped households into five equal size tiers (20% each) using 2024 U.S. Census Bureau survey data. Since the Census groups income into brackets rather than exact fifths, we estimated tier totals by matching estimated bracket averages to overall county income totals.
We looked at Allegheny County’s August 2026 property tax records. We took all residential properties with a positive market value, sorted them from lowest to highest value, and split them into five equal groups of properties to calculate each group’s share.
Sources: U.S. Census Bureau, American Community Survey 2024 one-year estimates; tables B19001 and B19025, accessed through Census Reporter. Allegheny County Property Assessments, assessment roll dated August 1, 2026, accessed through the Western Pennsylvania Regional Data Center.
Download the Data:
- ACS: https://data.census.gov/
- Allegheny County Property Assessments: https://data.wprdc.org/dataset/property-assessments
Leave a Reply